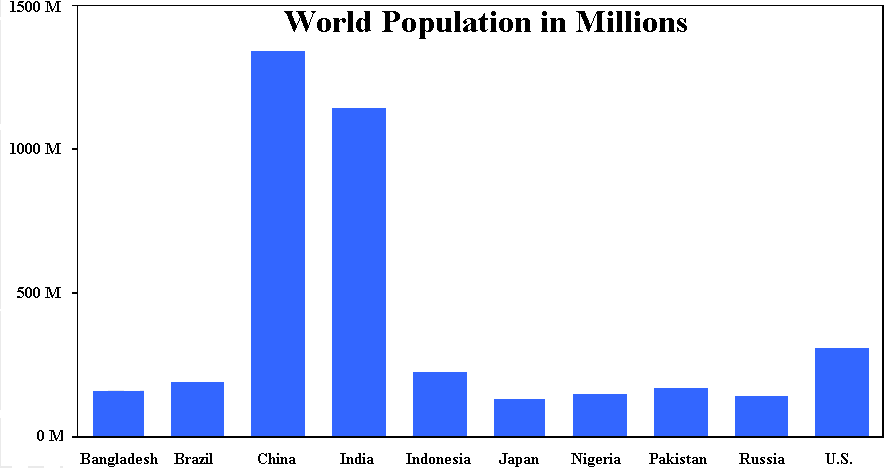
Bar graph
Draw vertical "bars" for each value in the sample for
comparison
.
The independent variables may be unrelated, and values may not show a
trend
.